Crypto data by and for the community
Dune is a web-based platform for querying Ethereum data by using simple SQL queries from pre-populated databases. Rather than writing a specialized script, you can query the database to extract almost any information that lives on the blockchain.
Dune Analytics Review And Best Alternatives
In this article, Dune Analytics review, we’re speaking about one of the unique crypto data platforms with a different experience than other crypto data platforms.
In regular English, a query means a request for information. Scientists implemented the same concept in query computing. Not only can you request data, but you can also add, remove, and manipulate data retrieved from databases.
Ethereum stores its data (transactions, addresses, etc.) in its blockchain. Dune Analytics translates that on-chain data inside the blocks into SQL databases so you can find any information you want using SQL codes. But doesn’t that require a programming background? In fact, yes, it does; however, Dune Analytics made that much easier.
In Dune Analytics, you can add pre-written SQL lines and request the data you want. Moreover, Dune Analytics will display it as a chart that you can export. You’ll have access to all on-chain Ethereum with a more detailed and flexible view.
Dune Analytics is widely used by projects using ETH tokens to display analysis from the ETH blockchain as charted metrics. Meaning it’s a business-to-business platform
About Dune Analytics.
Dune Analytics is a tool that dramatically simplifies the process. It is a web-based platform for querying Ethereum data by using simple SQL queries from pre-populated databases. Rather than writing a specialized script, you can query the database to extract almost any information that lives on the blockchain.
Also Read: Glassnode Review and Best Alternatives.
Dune Features.
Dune isn’t only a querying environment; it’s also a place where you get various features to work with and analyze data you’re getting from the database for your business.
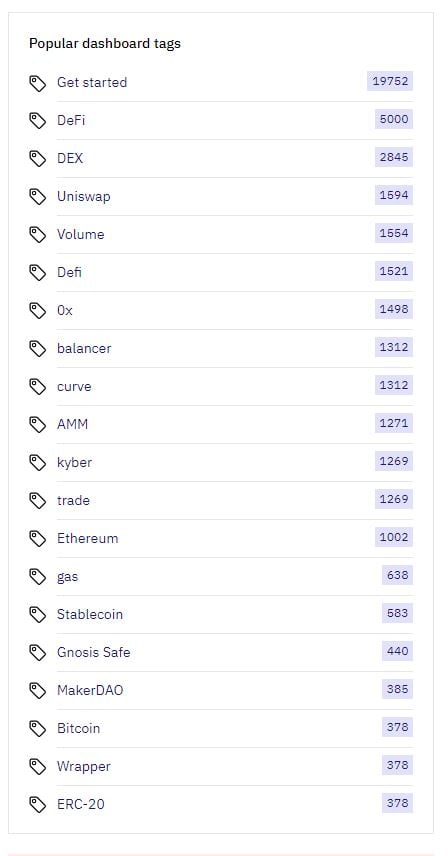
Popular Premade Dashboards.
On Dune, you don’t need to create a popular dashboard. You’ll find hundreds of premade Dashboards that you can favorite or view the written Query codes.
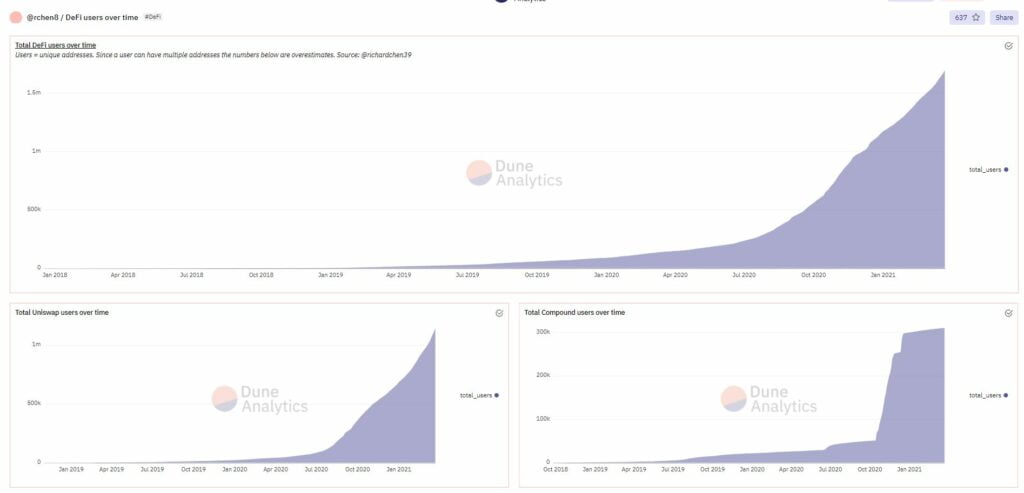
Besides, there are many metrics there that you can get lots of on-chain information out. For example, in the picture below, you can see a charted metric of DeFi (Decentralized Finance) users over time.
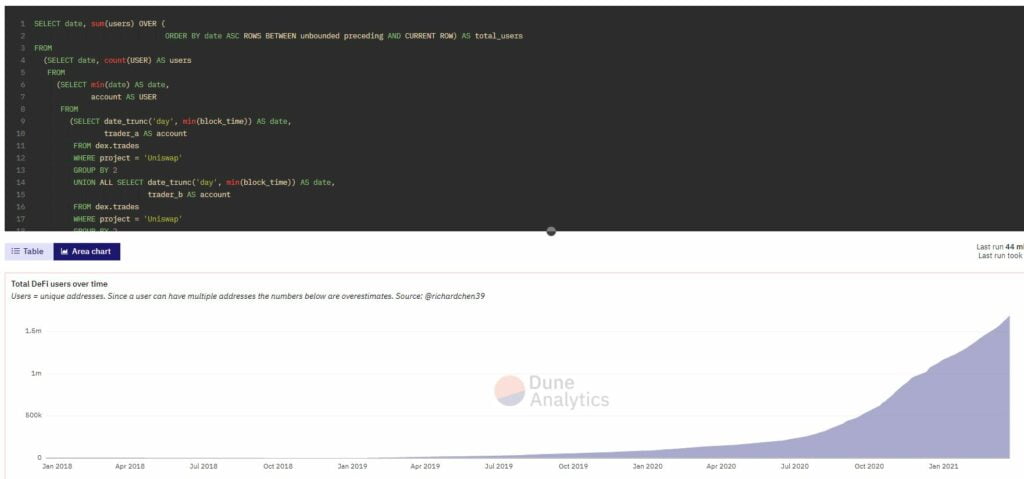
Upon clicking on any of the displayed metrics, you can view the query code written. That way, you can manipulate it the way you want.
Popular Premade Queries.
Just like we previously said in Popular Dashboard. You can see different popular queries categorized in the popular queries section to edit, run, and visualize.
You can also favorite any of the queries so you can run or edit them later.

Custom Dashboards.
If you’re not finding what you’re looking for in the premade dashboards and queries, which sound kind of impossible, you can create your own dashboard and start adding queries to it.
Pricing.
Dune has two plans, the free plan and the pro plan, for $390. You can view and compare both plans here.

Starting with Dune Analytics.
In the following part, we will illustrate how to use Dune and write your first SQL code to extract data from databases Dune Analytics made from the Ethereum on-chain data.
Writing Query on Dune.
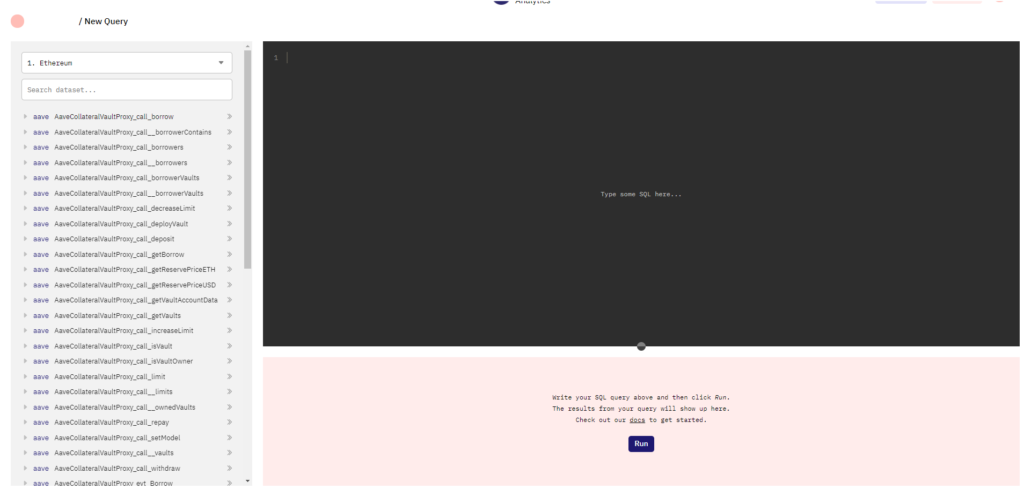
Writing queries isn’t hard. Firstly, click on ‘New Query’ on the top right of Dune UI. On the left sidebar, you’ll see different databases of Ethereum, and on clicking, you can see tables of each database.
For example, let’s write a query that shows the last five transactions made on-chain. Search for the transactions database, click on it, and now you can see transactions database tables, and they’re block_hash, block_number, data, etc.
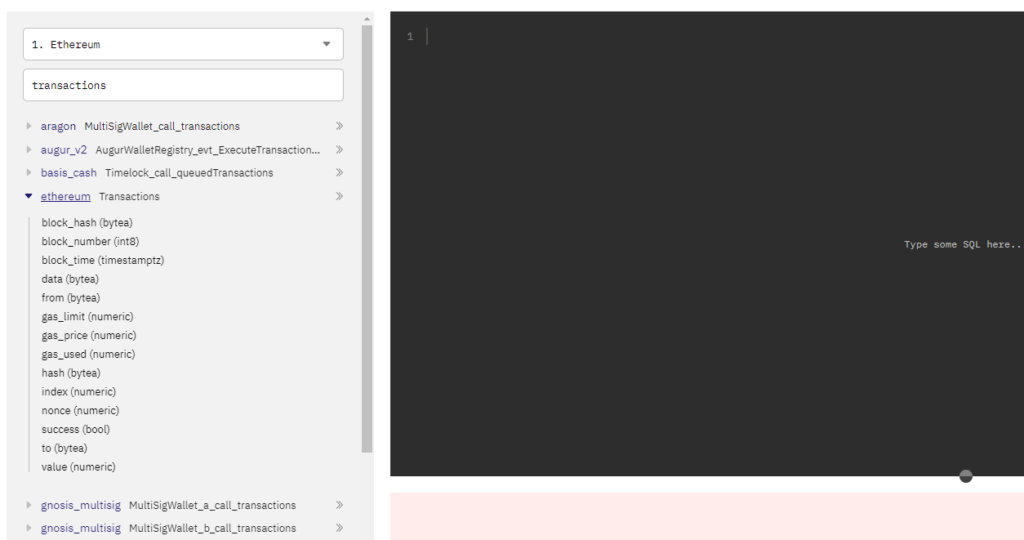
Now, the code will be as follows:
select * from ethereum.Transactions limit 5
At this point, we see details about the first 5 transactions that were ever made on Ethereum’s blockchain.
To see the last 5, we need to sort it in descending order as follows:
select * from ethereum.Transactions
order by block_time desc limit 5
Run it, and you’ll see information about the last 5 Ethereum transactions. Beautiful, isn’t it?
Visualizing Data on Dune Analytics.
After learning how to write code inside Dune, we can now learn how to visualize data.
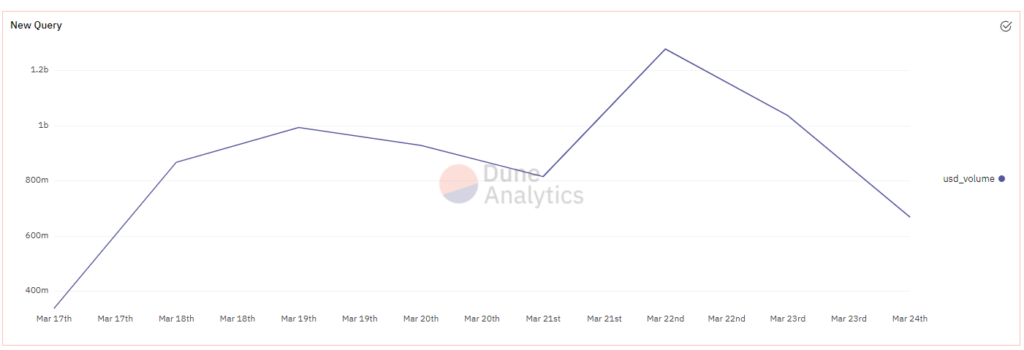
For example, let’s visualize the total Uniswap USD volume for the last 7 days using the following code:
SELECT date_trunc('day', evt_block_time) as day,
SUM(value/1e18)
SELECT
    date_trunc('day', block_time) AS day,
    SUM(usd_amount) AS usd_volume
FROM dex.trades
WHERE block_time > now() - interval '7 days'
AND project = 'Uniswap'
GROUP BY 1
ORDER BY 1;
After writing the code and running it, you can click on ‘New visualization’ and choose how you want to view the chart.

Dune Analytics Conclusion.
During our Dune Analytics review and experimenting with different query codes, we found that Dune possess a tremendous amount of data since the creation of ETH. You can find data that you wouldn’t find elsewhere on Dune. However, there are some things that we didn’t like—more in Dune Analytics pros and cons.
Pros.
- Access to all ETH databases.
- Visualization of data.
- Premade dashboard and written queries.
Cons.
- Hard to use.
- No chart editing.
- Poor UI


