Glassnode brings data intelligence to the blockchain and cryptocurrency space. Glassnode builds applications that provide new ways of delivering insights into blockchains and cryptocurrencies.
Glassnode Review And Best Alternatives
In this article, Glassnode review, we’re willing to look at Glassnode as one of the best on-chain data providers.
On-chain data is verified by miners, either PoS miners or PoW miners. Such accurate information shows how the market is moving. Furthermore, traders can predict prices, and accordingly, they can make better trading decisions.
Many platforms specialize in gathering on-chain data and charts it as metrics. Glassnode managed to perform such a complicated job successfully. Also, Glassnode has various metrics you wouldn’t have considered before, like UTXO value, Entity-Adjusted MSOL, and more.
It has different unique metrics, and Glassnode also has over ten years of data to help traders recognize repeated patterns; thus, they can apply the best possible strategies to their trading decisions.
About Glassnode.
Glassnode brings data intelligence to the blockchain and cryptocurrency space. Furthermore, Glassnode builds applications that provide new insights into blockchains and cryptocurrencies by focusing on the room’s most critical input source: data from the blockchains.
Also Read: Best Automated Crypto Trading Bots.
Glassnode Features.
Glassnode features many useful tools and functions, and during our Glassnode review, we found Glassnode worthy of the excellent reputation it has gained recently.
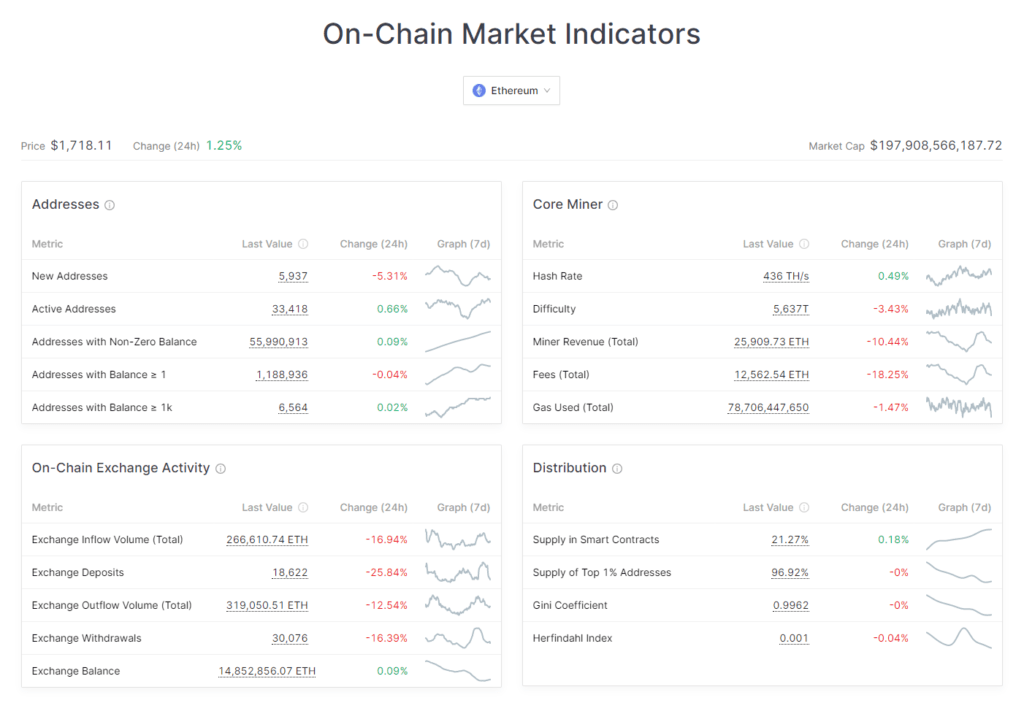
On-Chain Market Indicators.
Glassnode’s on-chain indicators will allow you to overview what’s happening on the chain to understand better how the market is moving.
You can see different on-chain market indicators for other coins like market cap, addresses, On-Chain Exchange Activity, and more on your home page.
Also, clicking on any metric, like active addresses or hash rate, gives you a detailed chart for that specific metric.
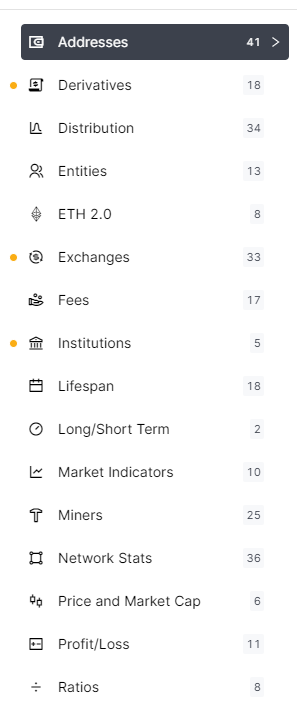
Various Charts Metrics.
Glassnode has over 200 categorized charted metrics with over ten years of data. Furthermore, you can favorite any of them to check on later.
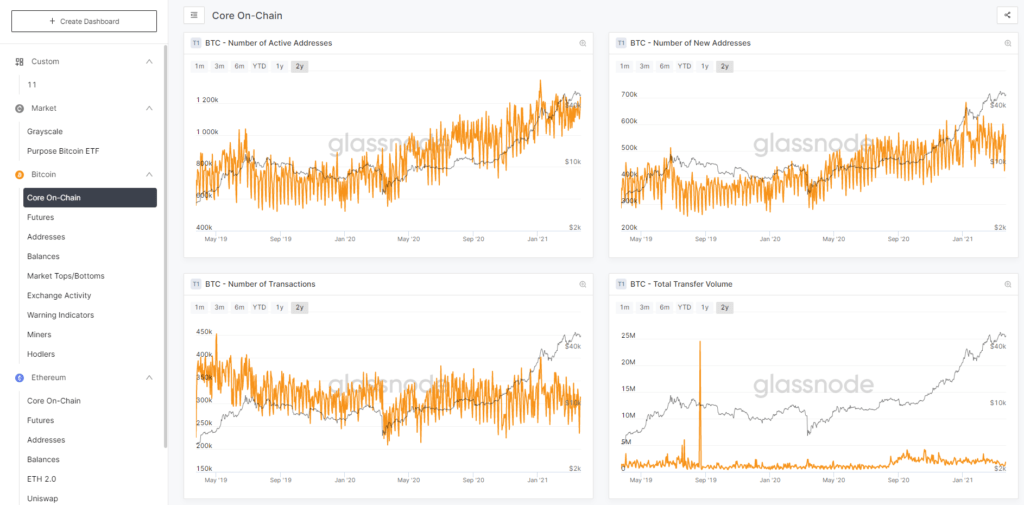
Multiple Dashboards.
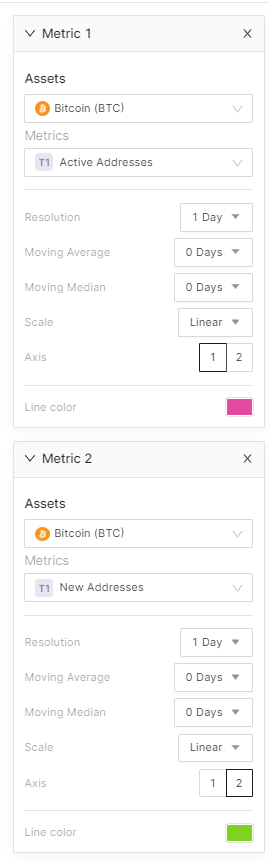
You can create your dashboard to view what you care about the most. You can create a dashboard for any of the supported coins. Furthermore, you can add your preferred metrics to the dashboard.
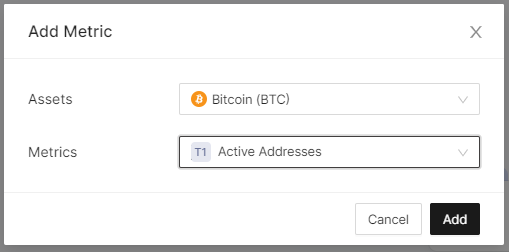
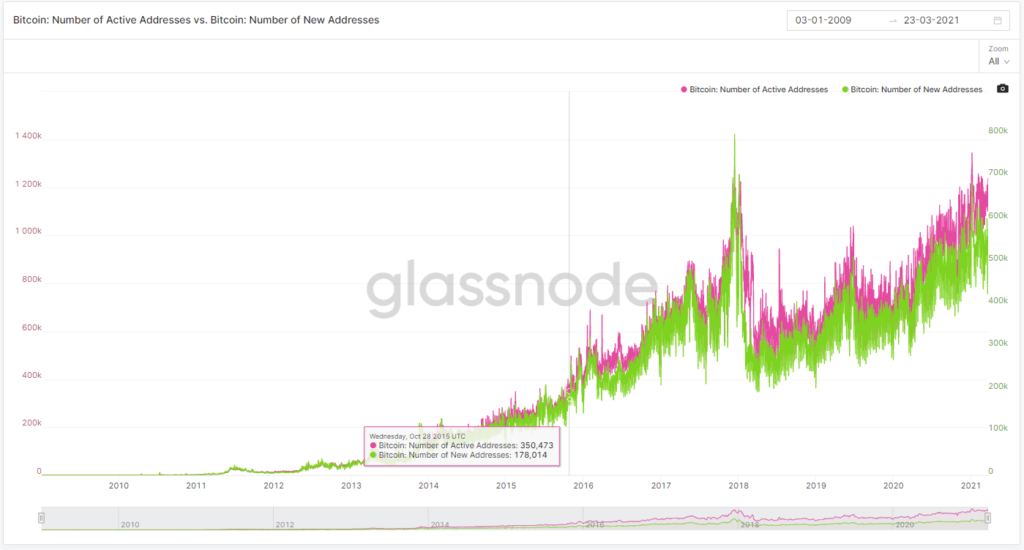
Comparing Coins.
Considering how many assets are supported and how many metrics are available for each, Glassnode also allows you to compare different metrics for different coins to get an overlayered chart containing both metrics.
Comparing charts will help you swap coins because your decision will be based on knowledge from comparing both coins with precise metrics.
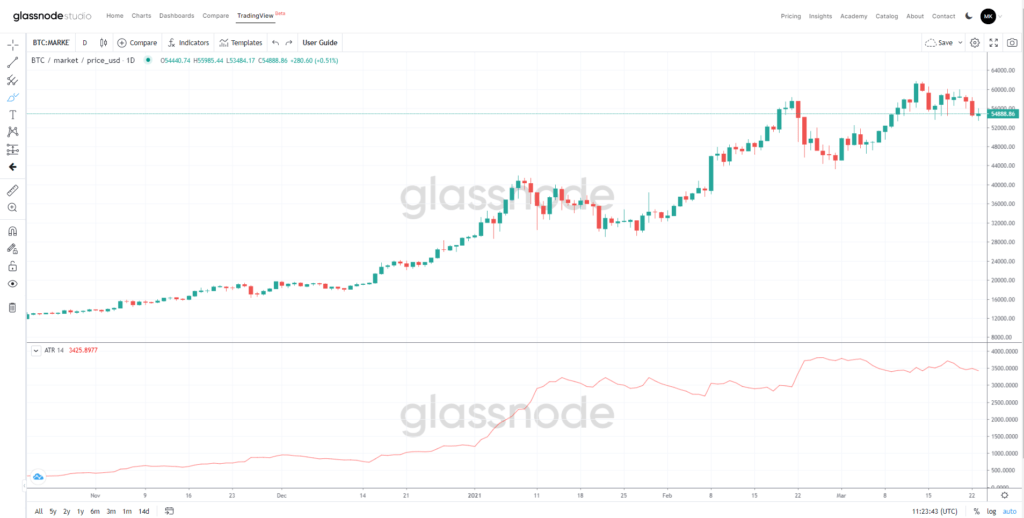
TradingView Integration.
You can have your TradingView charts editor inside your Glassnode Studio with almost all analysis tools available on TradingView. Moreover, you can edit charts and change indicators and candles. However, it’s still beta.
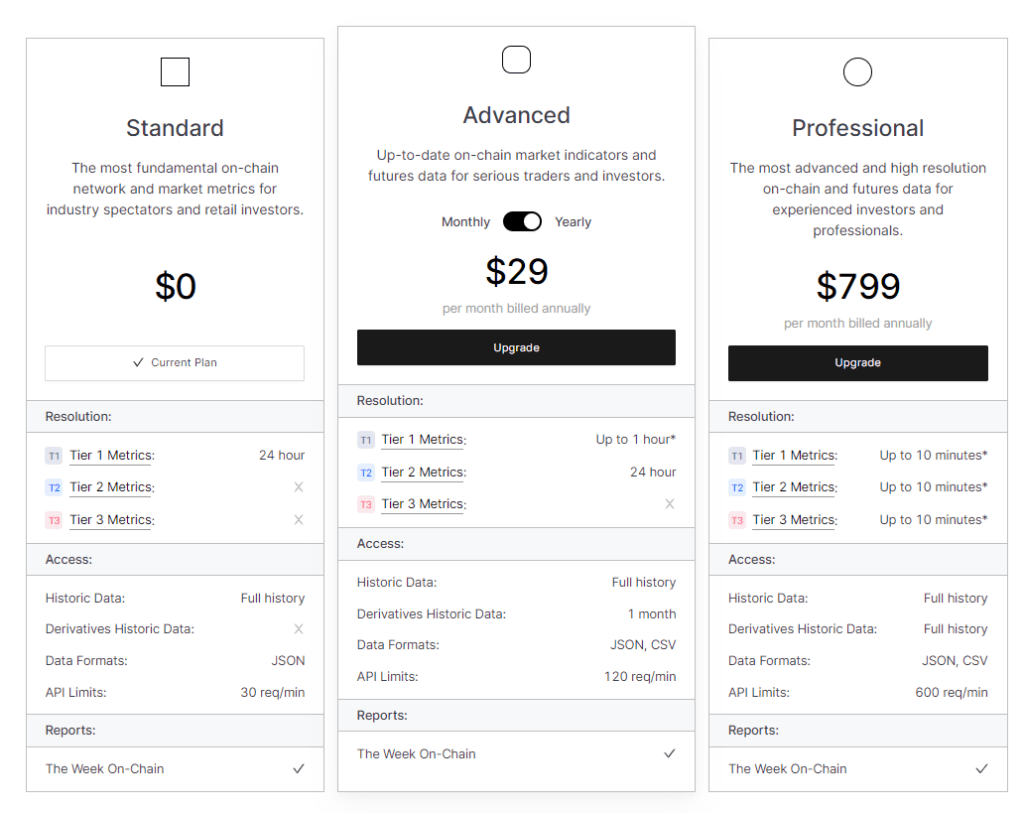
Pricing.
Glassnode prices are very competitive, with three plans: Standard, Advanced at $29, and Professional at $799. You can choose your plan and create your account here.
Conclusion.
Glassnode is a comprehensive on-chain data provider for both assets with either Proof of Stake or Proof of Work validating methods.
With that in mind, here’s Glassnode’s pros and cons.
Pros.
- An enormous number of metrics.
- Accurate on-chain data.
- Supports many assets.
Cons.
- Doesn’t have a watchlist.
- Doesn’t have alerts.
Glassnode Comparison and Alternatives Options.
If you don’t like Glassnode, we offer you various alternatives you can check. Also, we’ve reviewed them; check the reviews to get a better idea.
Finally, we’d love to chat with you in the comments, so tell us what you think of this Glassnode review.