Track All Markets
A social media, a charts analysis platform, and a mobile app. The company was founded in 2011, and now, every trader or investor needs to get started with TrandingView.
TradingView Review And Best Alternatives
Suppose you are interested in investing and want to learn about markets. You need to check the TradingView website and get started with TradingView.
About TrandingView.
TradingView is a social media charts analysis platform and a mobile app. The company was founded in 2011, and now, every trader or investor needs to get started with TrandingView.
“It’s an educational resource that’s really easy to use and can definitely help you learn more about specific stocks or markets in general,” –TradingView COO Stan Bokov.
Getting Started with TradingView.
Starting your TradingView account takes you only a couple of minutes.
Create Your Account.
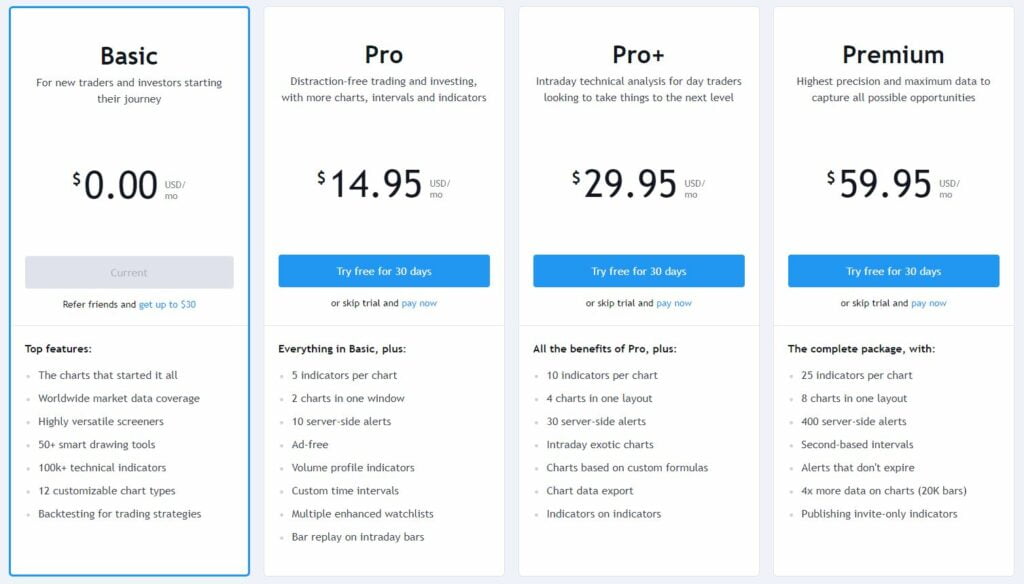
Firstly, visit the TradingView website; if you’re a casual trader, the basic plan will be okay. But, if you’re an expert, you probably need to check one of their paid plans.
After creating your account, go to your email and check for an activation link sent bythe TradingView team.
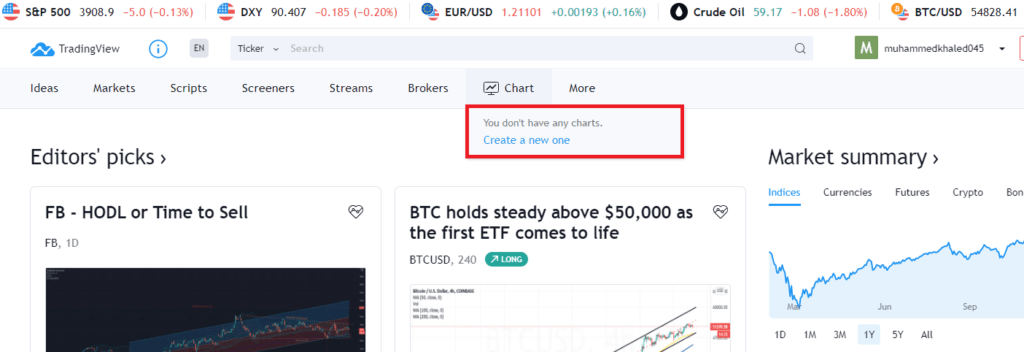
Create Your First Chart on TradingView.
You can start your first chart once you’ve signed in and on TradingView’s main page. Hover over the ‘charts’ tab on the top bar and click ‘Create a new one.’
Now you have created your first chart, and you can start editing and using TradingView’s handy tools that we will explain.
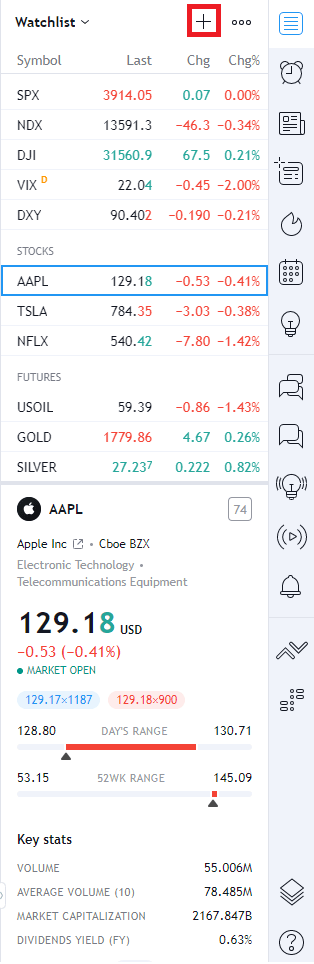
Chose Pairs and Add Them to the Watchlist.
Once you are on your chart, you can start choosing and customizing your watchlist to add the pairs you want to keep an eye on.
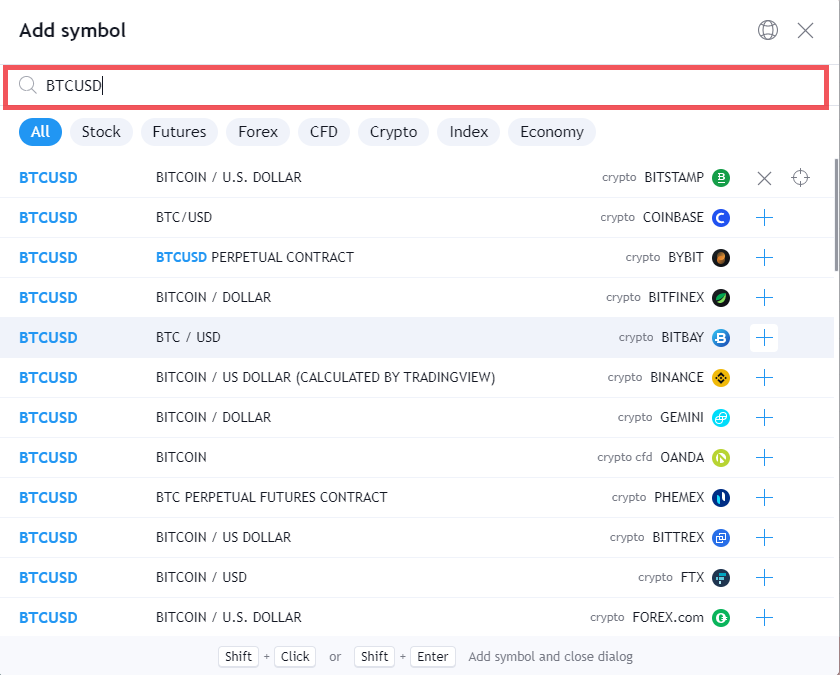
You can start by clicking the plus icon ‘Add symbol,’ then a box will pop up; start typing the pair you want to add.
We will use BTCUSD as an example. If we type BTCUSD, we will see different companies named Bitfinex, Bitstamp, Coinbase, etc. Try to choose the most reliable one, as those companies will provide data to your chart.
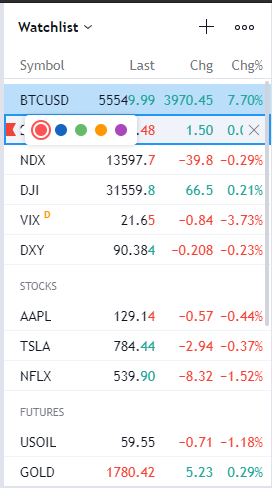
After you add a pair, it’ll be at the bottom of your watchlist. You can drag it to where you prefer it to be on the watchlist. Also, you can add a flag next to the pair by clicking the flag icon when you hover over the pair in your watchlist. You can also remove it by clicking the x icon.
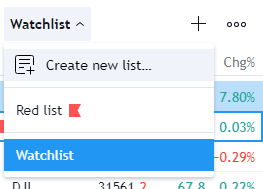
Also, you can create a custom watchlist separate from the default watchlist and add pairs by clicking on ‘Watchlist’ and then clicking on ‘Create a new list.’
Changing Timeframes and Candles.
You can start customizing your chart conveniently, as you can start changing timeframes for your chart and change candles.
Timeframes.
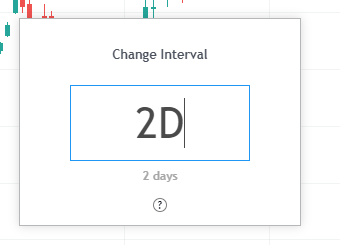
There are a couple of ways to change the timeframe. The easiest one is to type on your keyboard the number you want. It’ll be minutes by default, followed by a letter d for days, w for a week, and m for a month.
For example, if you want to change your timeframe to 2 days, you only need to hit 2 and then D on your keyboard.
Or you can go to the top bar and choose the timeframe you want; It can get down to seconds!

Candles.
You can customize your chart candles to many different ones. Start by clicking on the candles icon on the top bar next to the timeframe icon. Then, choose the candle you prefer.

Drawing Trends and Shapes on Chart.
The Left toolbar is convenient, as it incluvariousy of tools you can start editing your chart with.
You can add a trend line to your chart. Click on the line icon in the left toolbar, and then you can select from various shapes. Then click on ‘Trend Line.’ Or you can use its shortcut ‘Alt + T..’ Then you can start drawing on your chart.
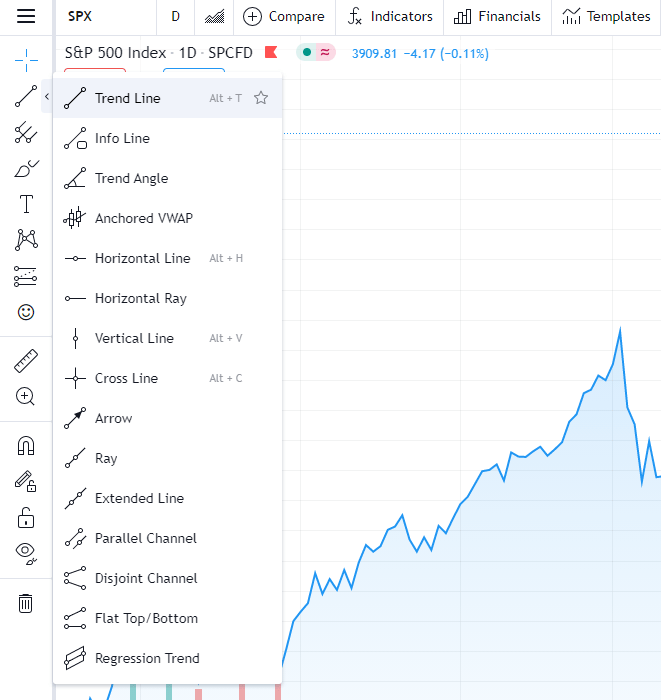
You can select other shapes like Pitchfork, a technical indicator that uses three parallel trend lines to identify possible support and resistance levels and potential breakout and breakdown levels.
Or you can use Long Position and Short Position, which will let you place your stop loss, entry, and take profit on your chart. Also, it will tell you your risk-to-reward ratio (RR).
Adding Indicators to Your Chart.
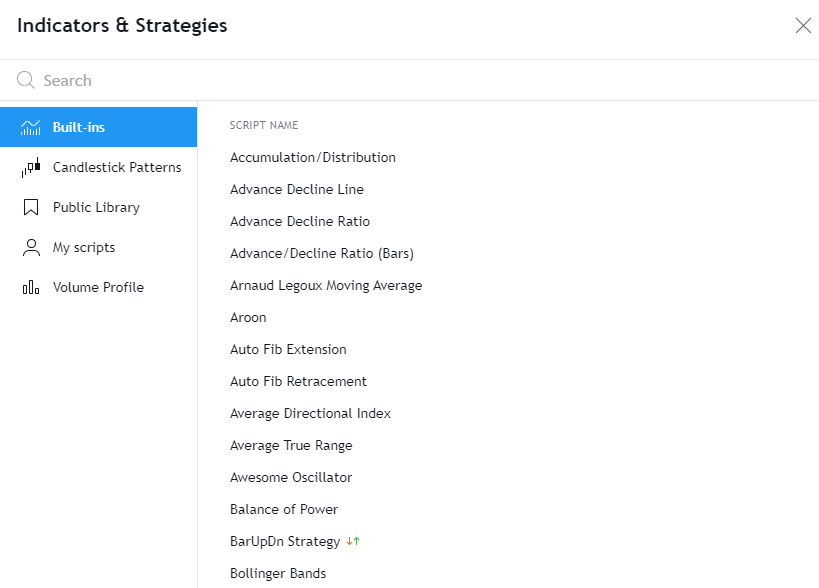
You can easily add indicators to your chart. TradingView has a list of the most valuable indicators. Some indicators give clear buy and sell signals; others must be interpreted based on a specific strategy.
Navigate to the top bar and click ‘Indicators,’ then you can add indicators to your chart. Also, you can know more information about each indicator by clicking the question mark next to its name.

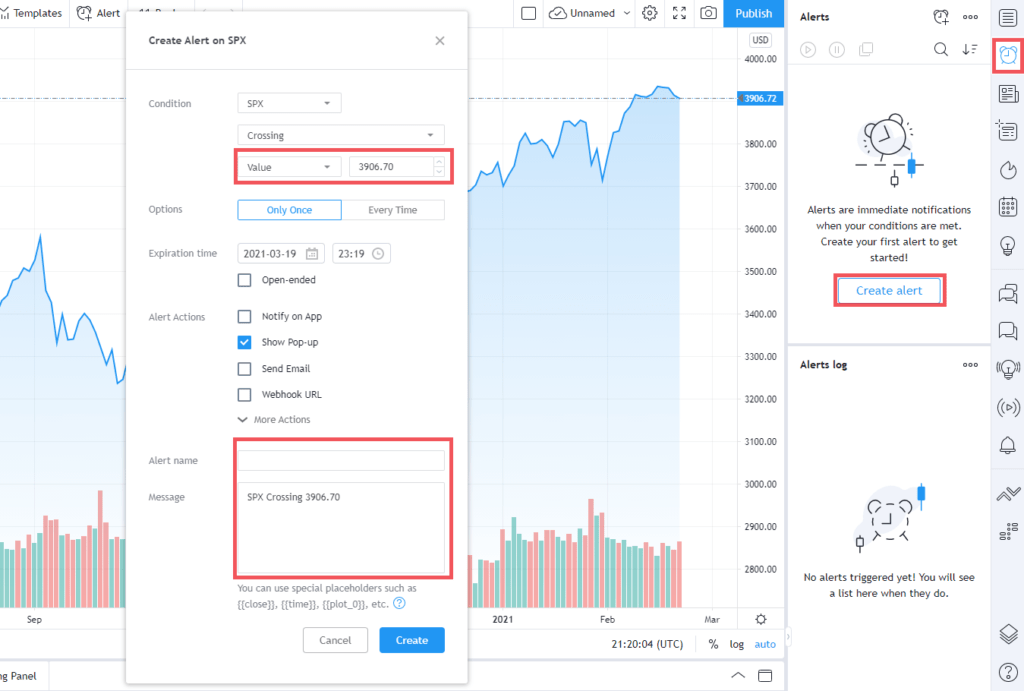
Add Alert Feature.
Another helpful feature in TradingView is the Add Alert feature. This will allow you to get alerts for an exact price point.
You can do that by right-clicking the price you want to get an alert for and how to get the notification, either by email or SMS, or you can get notified by TradingView App, which is available on both Google Play and App Store.
Also, you can change values for that point and use the alert icon in the right bar to do the same function.
You can also change the alert name and the message that will appear to you in case of an alert.