Actionable On-chain market intelligence and market data analytics
CryptoQuant delivers market and on-chain data via API or directly into Python, R, Excel, and many other tools. Save time and money by getting the data you need in your desired format.
CryptoQuant Review And Best Alternatives
In this article, CryptoQuant review, we’ll talk about exchange flows and how to access on-chain data to predict how the market is moving.
On-chain data is a meaningful metric that summarizes on-chain activities on the blockchain. Of course, on-chain data plays a significant role in the final price movements. By accessing complete historical on-chain data, traders can build insights about future market prices, leading them to make robust trading strategies.
During the past years, many analysis tools started forming on-chain data into charts and metrics so traders could easily access it without dealing with the blockchain. CryptoQuant is one of the very different analysis tools; CryptoQuant aims to provide complete, transparent on-chain data and other tools to make your experience more manageable.
About CryptoQuant.
CryptoQuant offers comprehensive data for crypto trading. It includes market data, on-chain data, and short/long-term indicators for Bitcoin, Ethereum, Stablecoins, and ERC20 tokens.
Also Read: Nansen Review and Best Alternatives.
CryptoQuant Features.
In the following part of CryptoQuant review, we’re putting CryptoQuant features under the light and explaining each part of the platform.
Charts Overview.
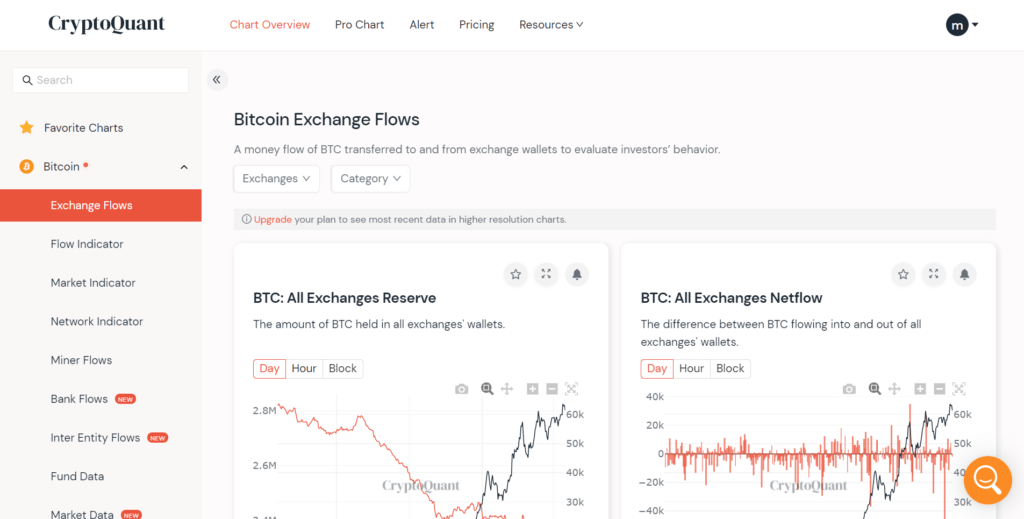
You can overview different charts and filter them according to exchanges or categories on that page. Also, on the left, you can choose metrics like Flow Indicator, Miner Flow, and more. That data is available for Bitcoin, Ethereum, Stablecoin, and Altcoins.
Exchange Flows.
One of the most popular metrics on CryptoQuant is exchange inflow/outflow. Exchange inflow is the amount of coins deposited into the exchange wallets, and exchange outflow is the amount of coins withdrawn from the exchange wallets.
If exchange inflow is high, traders transfer from their wallets into their exchange accounts, adding selling pressure. On the other hand, if exchange outflow is heightened, traders withdraw from their exchange accounts into their wallets, adding buying pressure.
Pro Chart.
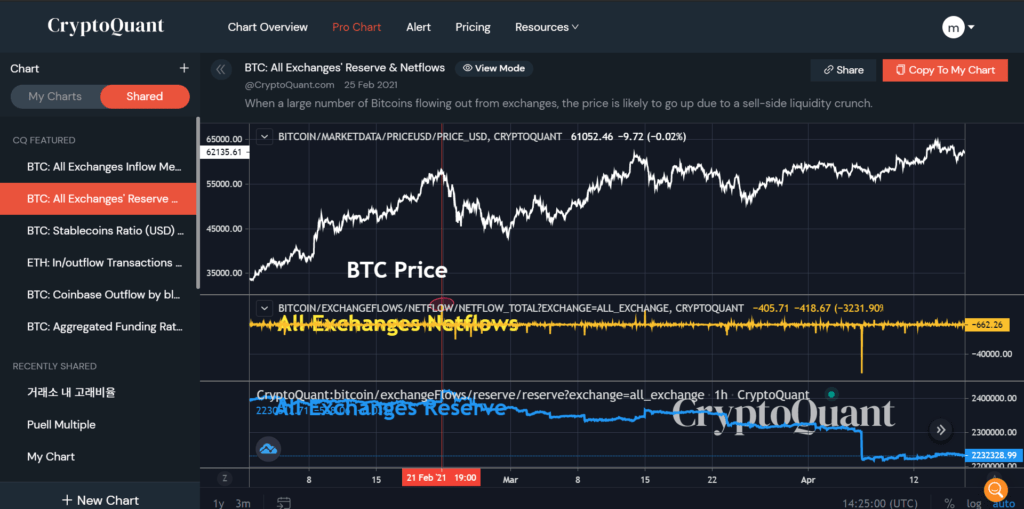
On Pro Chart, you can access previously made charts and indicators provided by TradingView. Also, you can create and share your own chart or access shared charts by other traders. That way, you can get shared ideas and never miss a good chance.
Alerts.
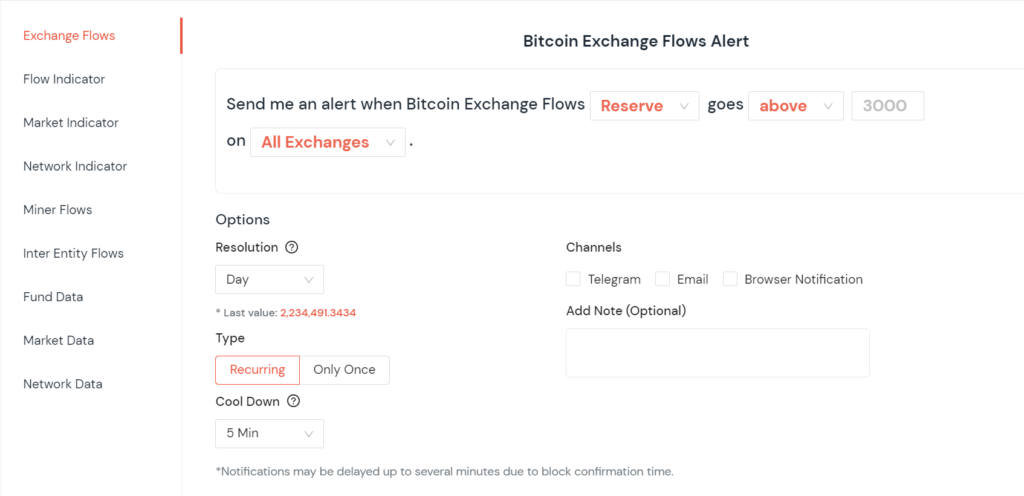
Using CryptoQuant alerts, you can get notified when strange activities may lead to sharp price movements. You can get notified on Telegram, email, or browser.
CryptoQuant Pricing.
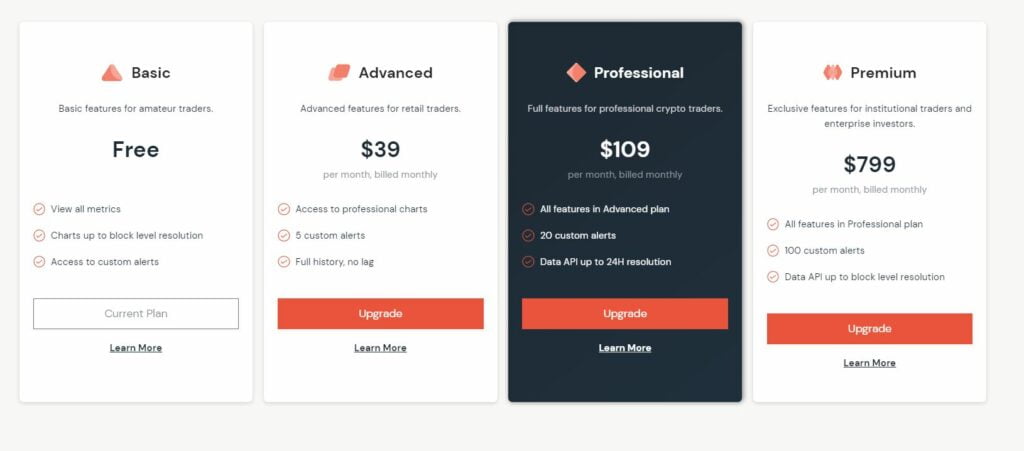
There are different plans for traders’ various needs. However, we don’t recommend using the free plan because of the vast limitations, like not accessing complete historical data. But, the paid plans are very reasonable, starting at $39 for the Advanced plan, $109 for the Professional plan, and $799 for the Premium plan.
Sign up on CryptoQuant.
To start on CryptoQuant and access all the mentioned features, visit the CryptoQuant Sign-up page here, then submit your information. Also, remember to use a strong and unique password.
After that, visit your email and find a verification link from the CryptoQuant team to confirm your account.

Conclusion.
After using CryptoQuant, we found that such an analysis tool is handy due to its different metrics and the complete historical data. By accessing such data, traders can implement new trading strategies, realize market anomalies by alerts, and get the most recent charts. And here are our pros and cons list for CryptoQuant.
Pros.
- Different metrics
- Up-to-date charts
- full historical data
- Charts editing.
Cons.
- Many limitations to the free plan.


